I put my ST35 on an old 15 MHz oscilloscope. I'm getting some curves which I look weird to me. Actually, I have no reference for how it ought to look, so it's hard for me to say what "normal" should look like.
I figured a sine wave would come out looking like a sine wave until it clipped. Then the tops and the bottoms of the peaks would flatten out, until the wave became perfectly square. I guess that ain't how it happens, is it?
Can anyone point me towards some pics of typical 'scope patterns, maybe with names for things ("clipping", "crossover distortion", "oscillation", etc.)? It'd be even better if they were taken on a DIY ST35. :)
Anybody put their ST35 on the 'scope?
11 posts
• Page 1 of 1
Anybody put their ST35 on the 'scope?
![]() by Ty_Bower » Mon Jul 30, 2007 8:06 pm
by Ty_Bower » Mon Jul 30, 2007 8:06 pm
-
Ty_Bower - KT88
- Posts: 1494
- Joined: Wed Mar 21, 2007 2:50 pm
- Location: Newark, DE
![]() by Ty_Bower » Sun Aug 05, 2007 9:57 am
by Ty_Bower » Sun Aug 05, 2007 9:57 am
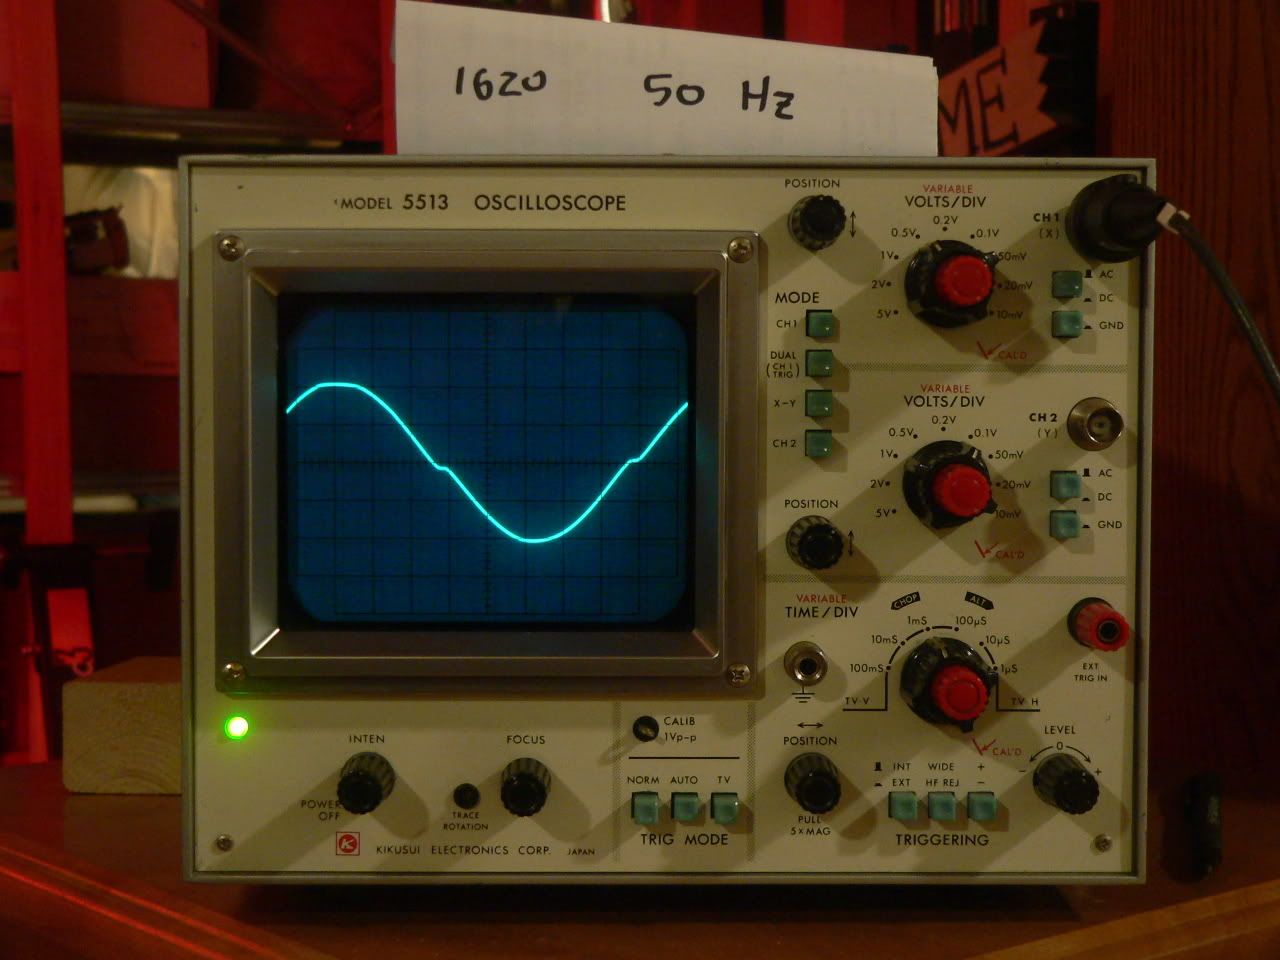
No takers? Here's some of my own. Comments are appreciated, both on my technique and my amp. Output transformers are Hammond 1620. B+ generally sits around 405 VDC. Tubes are biased at roughly 32 mA; cathodes are about 14.5 volts. Dummy load is 4 ohms on the 4 ohm tap.
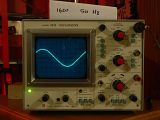
Here's a 50 Hz sine wave, driven to what I assume is just past the edge of clipping. The tops of the peaks are starting to flatten, and distortion is clearly visible just above and below the crossover point. The probe was set at 10x, so I calculate about 12.5 watts output power. The second picture shows the same tone with the volume knob backed down just a little.

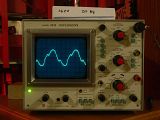
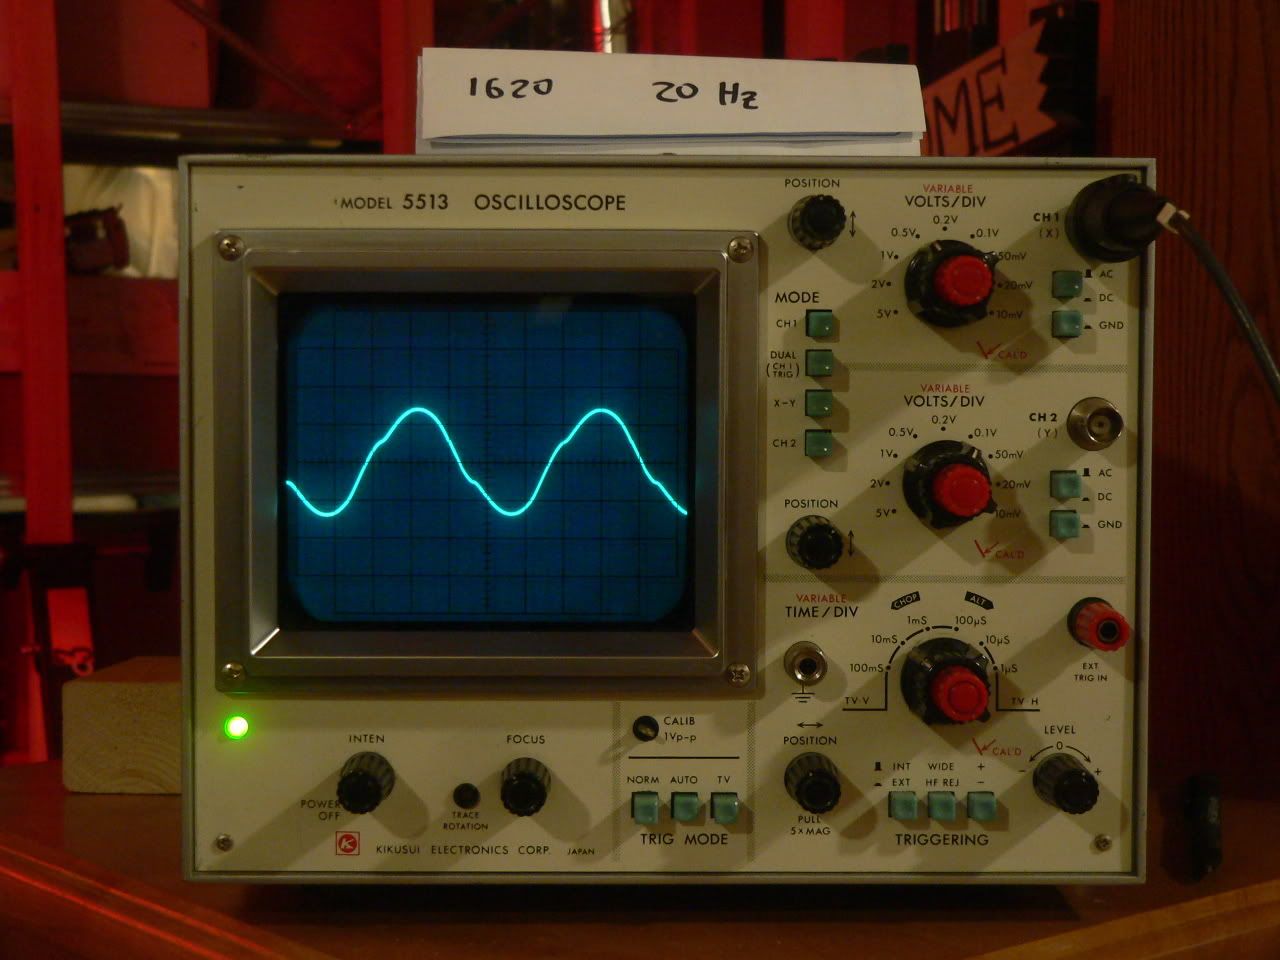
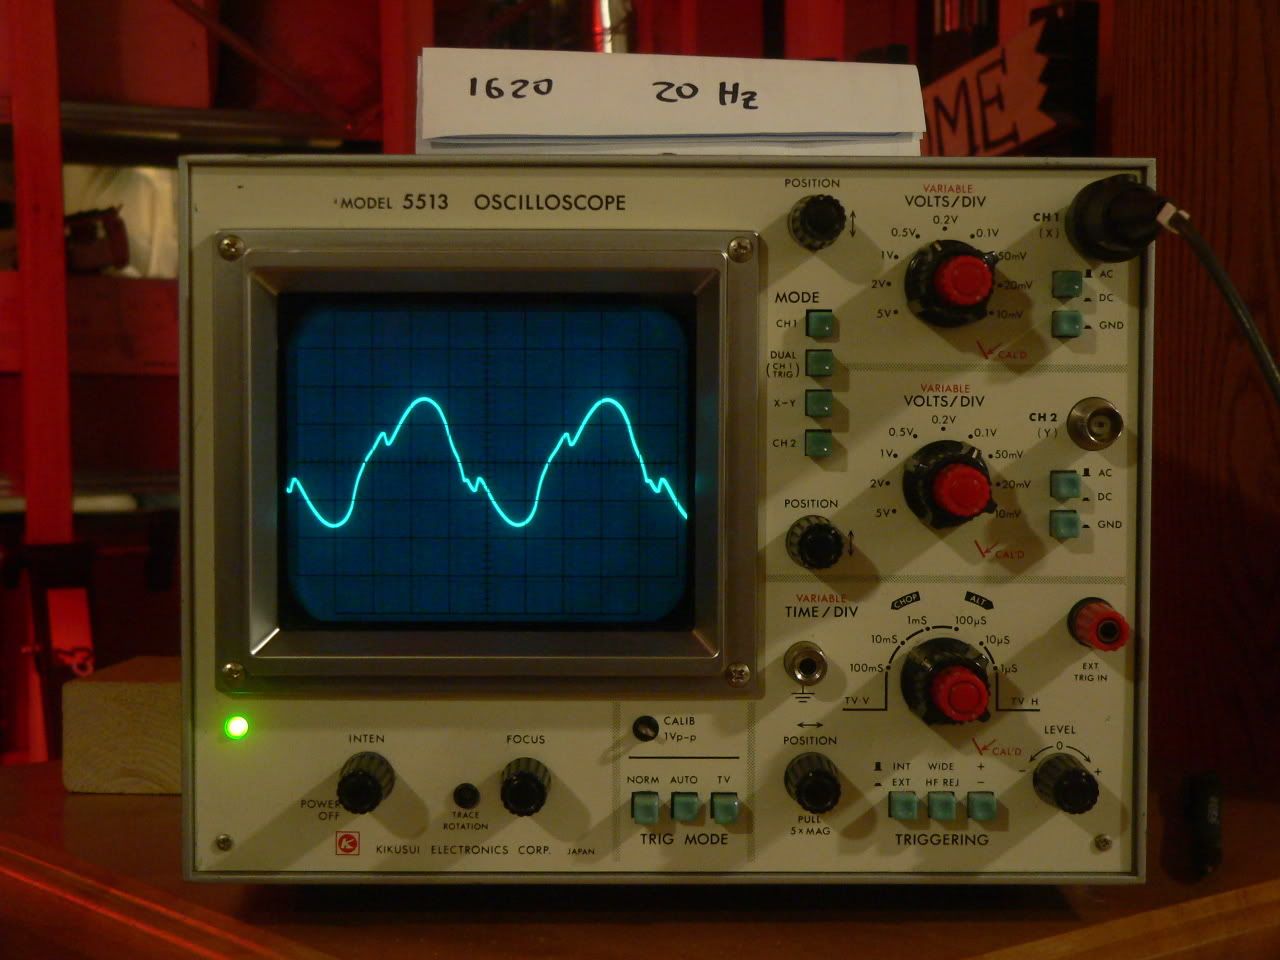
Here's the same setup, except with a 20 Hz sine wave. The volume is set just before visble distorion on the scope, and is increased slightly for each successive picture. The 1620s don't like 20 Hz sines. They produce weird distorion patterns at relatively (?) low power levels. I'm guessing I might get six volts, or 4.5 watts before it gets ugly. Fortunately, my speakers can only make wind at 20 Hz (no sound), so it doesn't matter much to me.


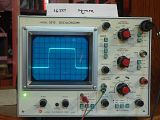
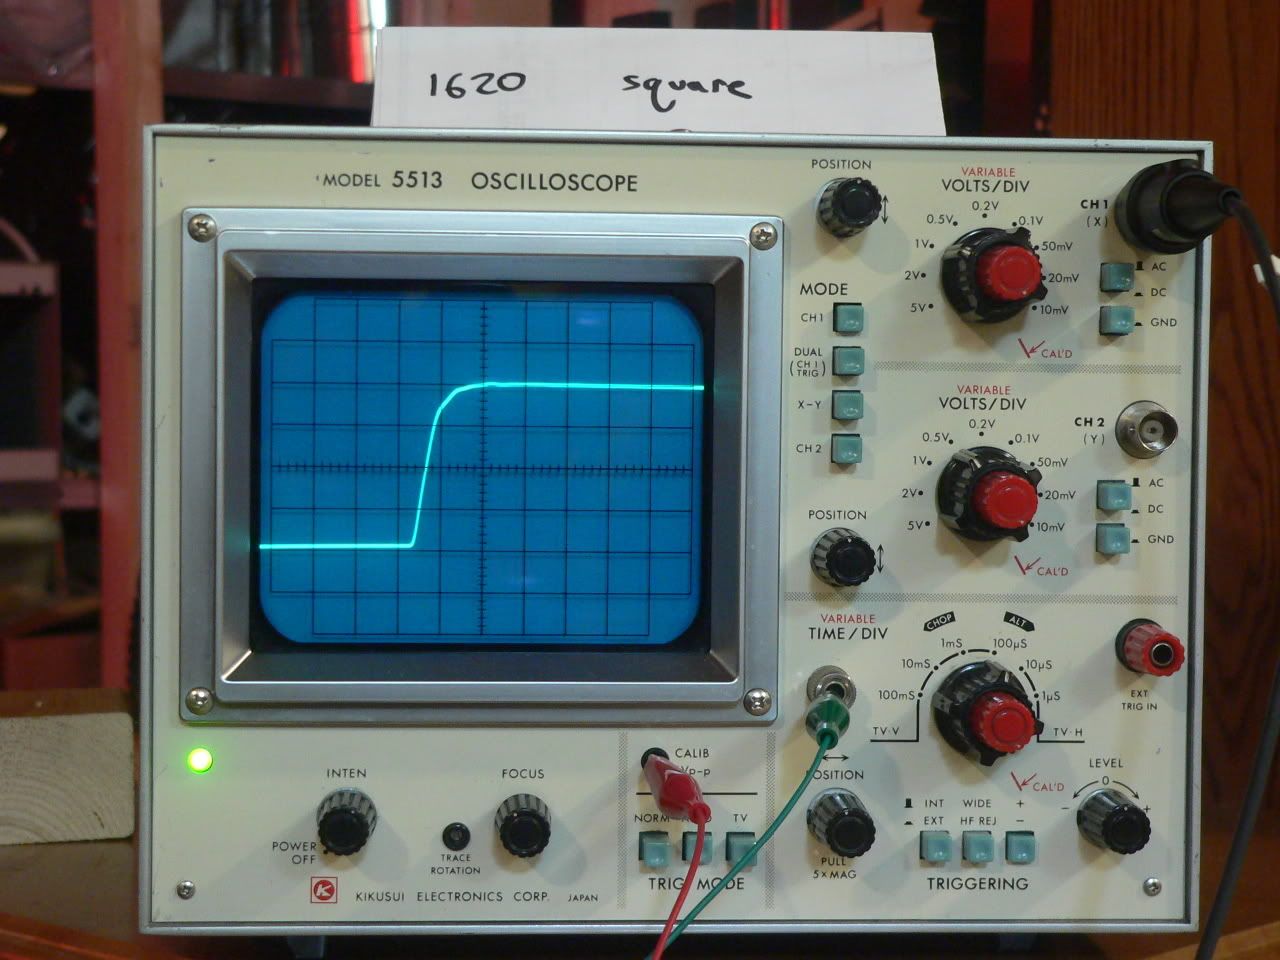
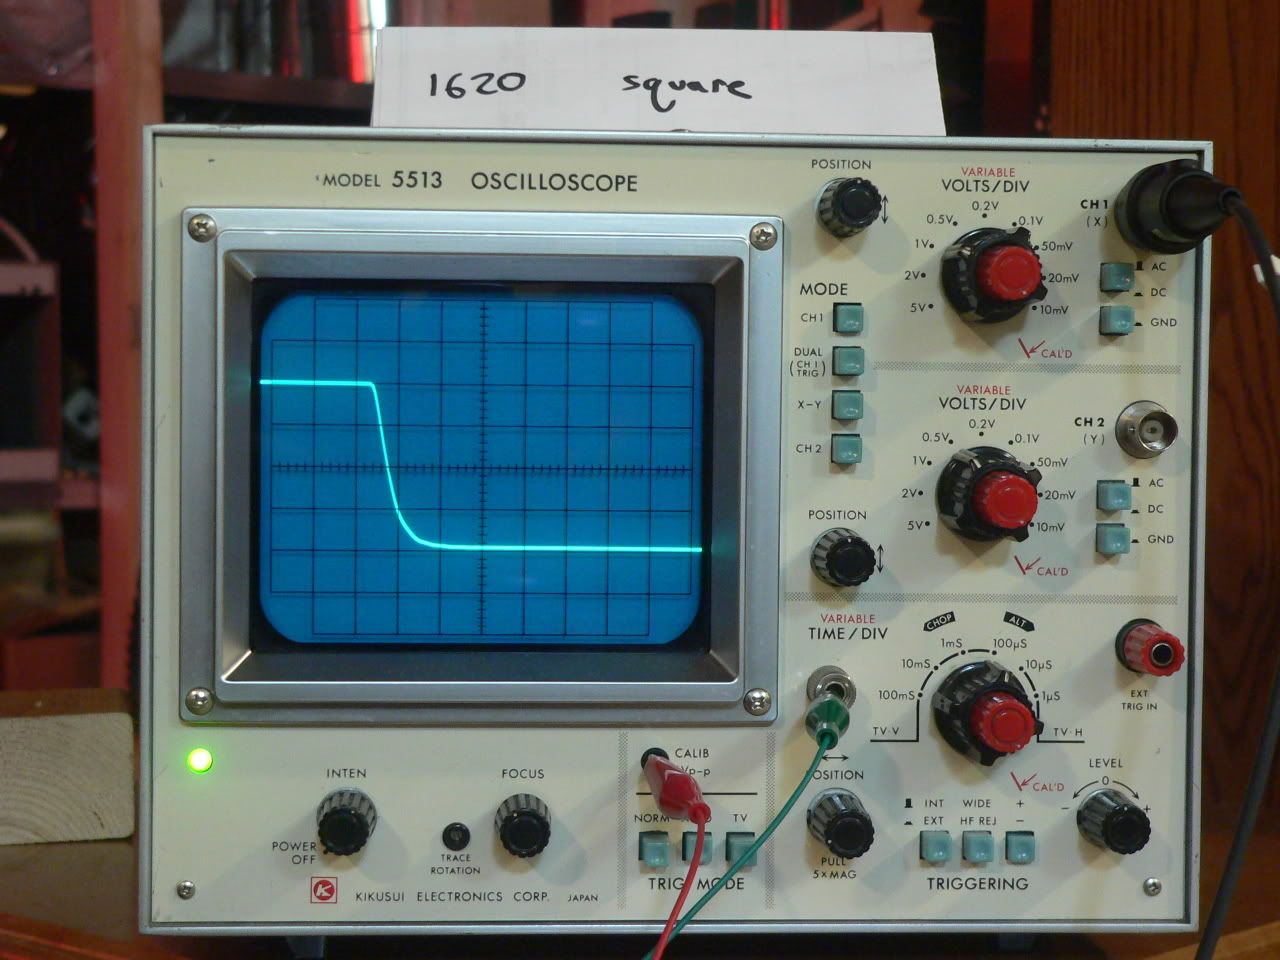
Here's a 1 kHz square wave. I changed the probe back to 1x for these photos. When measuring squares, I think the math is probably different for computing power. I think you omit the part where you divide by the root of 2. I drove these squares to 2.0 volts output, which I assume is 1 watt. The first pic shows the whole wave, while the next two give closeups of the leading and trailing edge. I'm interested to find out whether adjusting the NFB pot can sharpen up these corners.

Hopefully I'll be taking some more of these in the future, maybe with some different output transformers. Again, I'd welcome any tips for future testing.
Here's a 50 Hz sine wave, driven to what I assume is just past the edge of clipping. The tops of the peaks are starting to flatten, and distortion is clearly visible just above and below the crossover point. The probe was set at 10x, so I calculate about 12.5 watts output power. The second picture shows the same tone with the volume knob backed down just a little.

Here's the same setup, except with a 20 Hz sine wave. The volume is set just before visble distorion on the scope, and is increased slightly for each successive picture. The 1620s don't like 20 Hz sines. They produce weird distorion patterns at relatively (?) low power levels. I'm guessing I might get six volts, or 4.5 watts before it gets ugly. Fortunately, my speakers can only make wind at 20 Hz (no sound), so it doesn't matter much to me.

Here's a 1 kHz square wave. I changed the probe back to 1x for these photos. When measuring squares, I think the math is probably different for computing power. I think you omit the part where you divide by the root of 2. I drove these squares to 2.0 volts output, which I assume is 1 watt. The first pic shows the whole wave, while the next two give closeups of the leading and trailing edge. I'm interested to find out whether adjusting the NFB pot can sharpen up these corners.

Hopefully I'll be taking some more of these in the future, maybe with some different output transformers. Again, I'd welcome any tips for future testing.
-
Ty_Bower - KT88
- Posts: 1494
- Joined: Wed Mar 21, 2007 2:50 pm
- Location: Newark, DE
![]() by erichayes » Sun Aug 05, 2007 7:28 pm
by erichayes » Sun Aug 05, 2007 7:28 pm
Hi Ty,
Try going back to X10 and calibrate the probe. Somewhere on the 'scope front panel is a calibrated output voltage test point. Hook the probe to it and adjust the trimmer (it's either on the probe itself, or on the BNC connector) until you get the best looking square wave. Then go back to the amp and check it again.
That waveform (if it stays the same ) says you have slightly rolled off high frequency response. It could be the OTs, but a little tweaking of the PFB resistors (R38/39 in rev C) and/or the NFB caps (C16/17) might correct it.
Eric in the Jefferson State
- erichayes
- KT88
- Posts: 987
- Joined: Fri Jan 23, 2004 9:01 pm
- Location: McKinleyville CA
![]() by Ty_Bower » Wed Oct 17, 2007 9:28 pm
by Ty_Bower » Wed Oct 17, 2007 9:28 pm
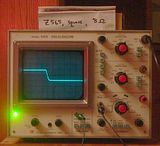
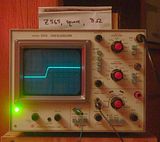
New transformers! Well, actually old ones... but new to me. I've got my hands on a pair of original Z565 outputs. In fact, they're mounted on an entirely different amp - Rev C board, PA771 power transformer, 6p14p-eb tubes, even a different CD player for input. In short, there's too many variables at this point to draw any conclusions. Regardless, I thought I'd post a couple quick 'scope photos I took tonight. I promise my testing method will become methodical in the near future.
Sorry for the crummy photos. Hopefully you can make out the important parts.
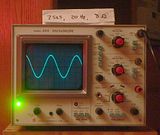
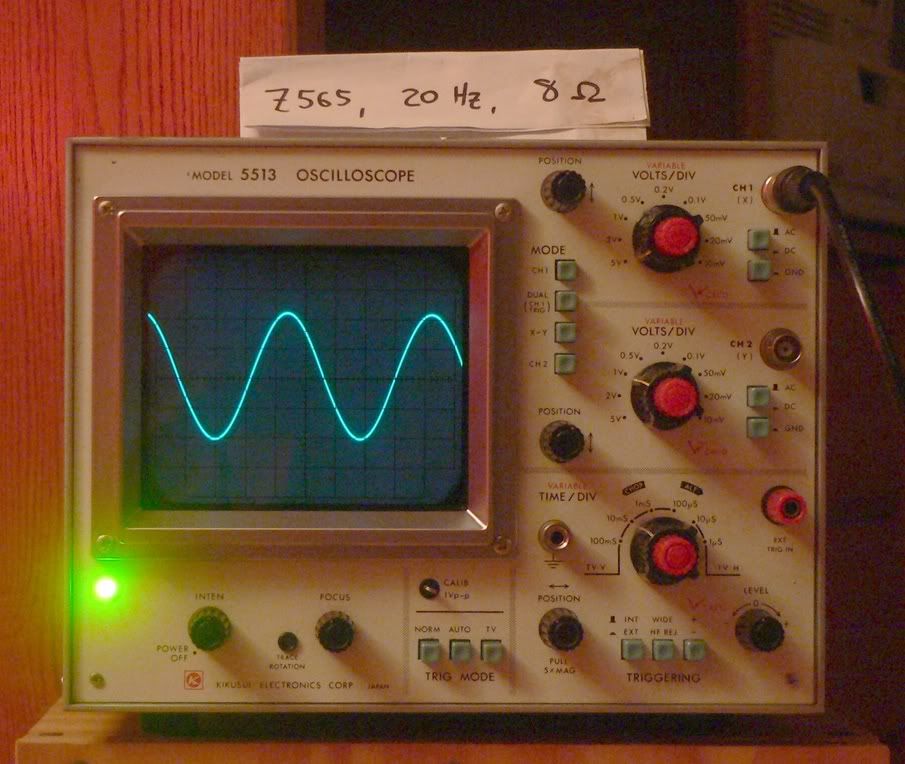
First, a 20 Hz sine wave. An 8 ohm dummy load is connected to the 8 ohm tap. I'm reading about 22 volts peak to peak, or roughly 7.5 watts output. The sine looks perfect to me - no signs of distortion. I'd crank it up more, but I've run out of gain. Maybe the line out on this CD player is low? Regardless, I'm getting a lot more clean, low frequency power than with the Hammond 1620. I need to swap around a couple parts (tubes, transformers, etc.) to figure out who to blame.
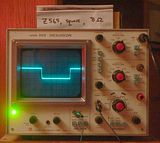
The 1 kHz square wave. Honestly, it doesn't look much different from the Hammonds. There is still some slop on the leading and trailing edge. Maybe it's in my scope, or maybe my technique needs improvement.
Sorry for the crummy photos. Hopefully you can make out the important parts.
First, a 20 Hz sine wave. An 8 ohm dummy load is connected to the 8 ohm tap. I'm reading about 22 volts peak to peak, or roughly 7.5 watts output. The sine looks perfect to me - no signs of distortion. I'd crank it up more, but I've run out of gain. Maybe the line out on this CD player is low? Regardless, I'm getting a lot more clean, low frequency power than with the Hammond 1620. I need to swap around a couple parts (tubes, transformers, etc.) to figure out who to blame.
The 1 kHz square wave. Honestly, it doesn't look much different from the Hammonds. There is still some slop on the leading and trailing edge. Maybe it's in my scope, or maybe my technique needs improvement.


-
Ty_Bower - KT88
- Posts: 1494
- Joined: Wed Mar 21, 2007 2:50 pm
- Location: Newark, DE
![]() by WA4SWJ » Thu Oct 18, 2007 6:11 am
by WA4SWJ » Thu Oct 18, 2007 6:11 am
Ty,
This is very interesting! And your pictures look quite good to me.
If I understand this correctly, I think you're measuring at the output terminals of the amp with a speaker load. That speaker load might have some impact on the waveform. The speaker impedance curve could be affecting your waveforms. Crossovers have lots of inductors and capacitors in them usually. Have you tried this technique with a resistive load? If you don't have one, Parts Express has some inexpensive 8 ohm "dummy load" resistors that you could try. I bought a couple of them and they're quite nice units.
You've inspired me to do this myself. I doubt I could do it this weekend but maybe next. I'll post some pictures of my ST-35 if I can get to it. Looks like I should be glad I used some Triode Dynaclone transformers instead of the Hammonds!
I've been meaning to do this for quite some time. But, it always seems that something else comes up.
Regards,
Ed Long
-
WA4SWJ - KT88
- Posts: 650
- Joined: Mon Dec 27, 2004 8:39 pm
- Location: Belleview, FL
![]() by Ty_Bower » Thu Oct 18, 2007 6:55 am
by Ty_Bower » Thu Oct 18, 2007 6:55 am
Yes, I do have a dummy load. I've got two of the old Radio Shack 8 ohm "non-inductive" cemented resistors. I think each one is rated for 20 watts or so. I've got them zip-tied to a chunk of Pentium heatsink. On the Hammonds, using the 4 ohm tap, I wire both in parallel to a single channel for a 4 ohm load. (I keep a junk speaker on the other channel, just in case.) For the Z565, I've connected a single 8 ohm dummy to the 8 ohm tap.
Yes, the measurements initally suggest the Z565 outperforms the Hammond 1620. The low frequency power handling seems much greater, and the corners of the square wave is a bit sharper.
But, I've got different tubes, different CD players, and different boards between the two amps. The voltages on the Hammond amp are slightly out of spec (~405 volt B+) due to the oddball power transformer I used. I need to keep more of the variables controlled before I start drawing any final conclusions.
Has anyone ever used the Arta software to try and measure the frequency response and THD of their tube amp?
-
Ty_Bower - KT88
- Posts: 1494
- Joined: Wed Mar 21, 2007 2:50 pm
- Location: Newark, DE
![]() by WA4SWJ » Thu Oct 18, 2007 7:18 pm
by WA4SWJ » Thu Oct 18, 2007 7:18 pm
Ty,
Well, you got me interested and I fired up the BitScope when I got home and sent some signals through my ST-35. I worked on the right channel first and then repeated everything on the left channel. The shots below were with an 8 ohm, 100 watt dummy load and the load got quite warm. This amp can crank out some stuff. I adjusted the feedback pots on each channel for the best looking square wave at 1 kHz on each channel before capturing the screen shots for that channel. Note that some of the shots have different time base settings but they all use 5 volts per division on the vertical scale into 8 ohms. The output tubes are Sovtek 6BQ5's. Output transformers are Triode Dynaclone Z-565-48's.
Looks like the low end needs some improvement as well as the top end. At 20 kHz the square wave looked mostly like a sine wave (the amp was not clipping because I checked). I didn't take any 20 kHz shots. All of these shots are just below clipping. I adjusted the oscillator output until the amp clipped and then just backed it off until the clipping stopped.
So here goes:
First the 10 kHz runs sine and square waves - Left Sine/Square then Right Sine/Square:


Now 1 kHz - Left Sine/Square then Right Sine/Square:


Finally 20 Hz - Left Sine/Square then Right Sine/Square:


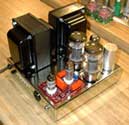
And last of all, here's a picture of the amp taken a couple of years ago when I first built it.

Pretty neat stuff. I'd love to hear comments.
Regards,
Well, you got me interested and I fired up the BitScope when I got home and sent some signals through my ST-35. I worked on the right channel first and then repeated everything on the left channel. The shots below were with an 8 ohm, 100 watt dummy load and the load got quite warm. This amp can crank out some stuff. I adjusted the feedback pots on each channel for the best looking square wave at 1 kHz on each channel before capturing the screen shots for that channel. Note that some of the shots have different time base settings but they all use 5 volts per division on the vertical scale into 8 ohms. The output tubes are Sovtek 6BQ5's. Output transformers are Triode Dynaclone Z-565-48's.
Looks like the low end needs some improvement as well as the top end. At 20 kHz the square wave looked mostly like a sine wave (the amp was not clipping because I checked). I didn't take any 20 kHz shots. All of these shots are just below clipping. I adjusted the oscillator output until the amp clipped and then just backed it off until the clipping stopped.
So here goes:
First the 10 kHz runs sine and square waves - Left Sine/Square then Right Sine/Square:
Now 1 kHz - Left Sine/Square then Right Sine/Square:
Finally 20 Hz - Left Sine/Square then Right Sine/Square:
And last of all, here's a picture of the amp taken a couple of years ago when I first built it.
Pretty neat stuff. I'd love to hear comments.
Regards,
Ed Long
-
WA4SWJ - KT88
- Posts: 650
- Joined: Mon Dec 27, 2004 8:39 pm
- Location: Belleview, FL
![]() by Ty_Bower » Thu Oct 18, 2007 8:36 pm
by Ty_Bower » Thu Oct 18, 2007 8:36 pm
Excellent work! It'll take me a while to absorb everything you've found.
I'm particularly interested in your 20 Hz response traces. I'm thinking hard about the maximum peak to peak voltage you've measured at 20 Hz. On the (genuine original Dynaco) Z-565 amp I'm running, I'm seeing nearly identical results - about 22 volts peak to peak. Were you able to drive your ST35 into clipping? Without a preamp, I do not think the one I am testing will. The waveform is perfectly clean, but still far below the rated output.
Your square waves are positively brutal. I haven't dared drive a square to the levels I see in your traces. I've kept mine under one or two volts (zero to peak). You might not have your center line perfectly zeroed, but it seems like you're driving almost ten volts out the square. I'm wagering the tapering off you see at the end of the wave is just the power supply pooping out. Otherwise, the corners look sharp and flawless.
Thanks for your effort, and the input. Now I have something to compare to my own amp.
-
Ty_Bower - KT88
- Posts: 1494
- Joined: Wed Mar 21, 2007 2:50 pm
- Location: Newark, DE
![]() by Shannon Parks » Fri Oct 19, 2007 5:15 am
by Shannon Parks » Fri Oct 19, 2007 5:15 am
Hi Guys,
Here's an old post of mine from the ST35 Manual & BOM thread:
Here's an old post of mine from the ST35 Manual & BOM thread:
separks wrote:I'm testing out my new audio analysis software and here's some first fruits:
ST35 Rev D Excel Files
I've got Excel files with log charts of distortion and gain for open loop, 1W, 10W and 14.8W outputs. Neat stuff!
Shannon
- designer of fine tube audio gear at (((parks audio)))
- founder and admin of the diytube forums
-

Shannon Parks - Site Admin
- Posts: 3764
- Joined: Tue Mar 18, 2003 5:40 pm
- Location: Poulsbo, Washington
![]() by WA4SWJ » Fri Oct 19, 2007 6:03 am
by WA4SWJ » Fri Oct 19, 2007 6:03 am
Hi Ty,
Yes, I did notice some offset in the output waveforms but I attributed that to my makeshift test setup since I didn't pay a whole lot of attention to the grounds. Maybe that's not the case. I might try it on an old 15 MHz analog scope over the weekend and see how it looks in comparison. I was thinking about that offset when I noticed it, but have not come to any conclusions yet. BTW, the raggedness on some of the waveforms near the tops is due to quantization error in the BitScope A/D converter. It's a nice little gadget, but it has its limitations.
Yes, I was able to clip the amp with no problem across the frequency range. In fact, I had the volume control set at about 50% during the entire set of tests. I was driving it with a Tenma oscillator and it has enough output to clip the amp quite easily. I did not measure the input voltage at clipping. That's another little task that would be interesting, but Shannon has posted that before. I'm sure my amp would not be far off of those - but then again I do have some different tubes in there.
The low frequency sine wave output looks pretty good down to about 15 Hz. Below that it begins to look like your traces at 20 Hz. And I agree with you, the low frequency square wave tilt is likely due to the power supply. I was mostly interested in seeing what the amp would crank out so I didn't check lower power level square waves at low frequencies. Something else to try next. The iron was singing with those square waves cranking through at 1 kHz! The amp just sat there and took it all with no problems. As I mentioned in the earlier post, the dummy load got quite warm. The output transformers did not.
I also noticed that the amp produced decent sine waves with almost no loss of gain up to about 40 kHz. I'll have to look at that again to make sure I wasn't seeing things and if I find anything interesting I'll post some more screen shots.
Once this one is done I might give the ST-70 a shot. And then all those eiclones ..... and then the poseidons ...... then the 832 amp ....... and don't forget the GSG ....... fun for months on end!
Ed Long
-
WA4SWJ - KT88
- Posts: 650
- Joined: Mon Dec 27, 2004 8:39 pm
- Location: Belleview, FL
11 posts
• Page 1 of 1
Who is online
Users browsing this forum: No registered users and 61 guests