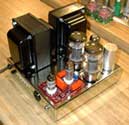
I've wanted to plot curves for a while now, and finally modified my Kenwood power supplies to use voltage control for remote programming. I then grabbed a couple HP 59501B Isolated Programmable DACs off of eBay, and viola! The Excel file below is an RCA 12AX7 gray plate out of my stash that is most representative of a true 12AX7 out of the first dozen tubes I've tested. Hopefully I can start a new datasheet archive with many tube varieties.
While this is an Excel 2003 document, I was able to import into a Google doc. I presume Linux users (Geek et al) can use Open Office with success - let me know. This is more than pretty curves, as there's a schload of data you can fiddle with. I mean, you can print out a nice 8.5" by 11" chart to draw loadlines on, but you can also do all kinds of linear equations with the data. Starting at cell A27, you can see I've calculated Rp, Gm and Mu at one particular spot (the standard Va=250V, Vg1=-2V, Ia=1.2mA, Rp=62.5K, Gm=1600) for both halves. You can edit those formulas for any particular biasing point. For Rp, I would use the biasing B+ and 10V above and below. For Gm , I would use the bias grid voltage and the next step higher. In this case I used -2V and -1.5V.
http://www.diytube.com/curves/RCA12AX7.xls
Shannon
New 12AX7 Curves - Real Data, Not Simulated
7 posts
• Page 1 of 1
New 12AX7 Curves - Real Data, Not Simulated
![]() by Shannon Parks » Fri Jun 08, 2012 6:11 am
by Shannon Parks » Fri Jun 08, 2012 6:11 am
-

Shannon Parks - Site Admin
- Posts: 3764
- Joined: Tue Mar 18, 2003 5:40 pm
- Location: Poulsbo, Washington
Re: New 12AX7 Curves - Real Data, Not Simulated
![]() by Geek » Fri Jun 08, 2012 4:14 pm
by Geek » Fri Jun 08, 2012 4:14 pm
separks wrote:I presume Linux users (Geek et al) can use Open Office with success - let me know.
100% success!

Thanks Shannon, lookin' great!

Cheers!
*edit*
How easy is it for you to do this? Tom Schlangen (aka Serpentine or Tubes4e4) did a bunch of TV tubes suitable for audio, but fully manual and was a pain for him

There's undocumented-curve gems in the TV toob scrapbox to be found!

-= Gregg =-
Fine wine comes in glass bottles, not plastic sacks. Therefore the finer electrons are also found in glass bottles.
Fine wine comes in glass bottles, not plastic sacks. Therefore the finer electrons are also found in glass bottles.
-
Geek - KT88
- Posts: 3585
- Joined: Sun Oct 21, 2007 3:01 am
- Location: Chilliwack, British Columbia
![]() by Shannon Parks » Sat Jun 09, 2012 5:44 am
by Shannon Parks » Sat Jun 09, 2012 5:44 am
I have it fully automated, so curve tracing anything is a piece of cake. Takes about 15 minutes to do a 12AX7, for example. The limit is really my Kenwood 500V supply - it takes about 1 sec to settle for every 10V jump. Anyhow, you can put your requests here. First I plan to sweep about every tube I have. LOL!
My voltage limits are 0 to -250V for the grid, 500V @ 125mA for the B+ and 110V @ 2.5A for the filament, so I think we can test about anything. I'm using an HP 3488A switch for helping with the twin triode testing and it really speeds things up. I just have a jig for the socket, but I plan to tear apart a small emission tester and use it as the test jig (with all its switches). My DMM is the trusty old HP 3455A.
Shannon
-
Shannon Parks - Site Admin
- Posts: 3764
- Joined: Tue Mar 18, 2003 5:40 pm
- Location: Poulsbo, Washington
![]() by Geek » Sat Jun 09, 2012 5:48 am
by Geek » Sat Jun 09, 2012 5:48 am
Fantastic!
Can I trouble you, humbly, for pentode and triode curves of a 21GY5?
I can send you some if you need
Cheers!
Can I trouble you, humbly, for pentode and triode curves of a 21GY5?
I can send you some if you need
Cheers!
-= Gregg =-
Fine wine comes in glass bottles, not plastic sacks. Therefore the finer electrons are also found in glass bottles.
Fine wine comes in glass bottles, not plastic sacks. Therefore the finer electrons are also found in glass bottles.
-
Geek - KT88
- Posts: 3585
- Joined: Sun Oct 21, 2007 3:01 am
- Location: Chilliwack, British Columbia
![]() by Shannon Parks » Sun Jun 10, 2012 4:59 am
by Shannon Parks » Sun Jun 10, 2012 4:59 am
No prob, but I will need you to send me some. Still sorting out my pentode test setup. Did a slew of 12AU7 types yesterday.
Shannon
Shannon
-
Shannon Parks - Site Admin
- Posts: 3764
- Joined: Tue Mar 18, 2003 5:40 pm
- Location: Poulsbo, Washington
![]() by Geek » Sun Jun 10, 2012 5:03 pm
by Geek » Sun Jun 10, 2012 5:03 pm
Thank you!!!!
Silly me didn't copy your address from the Budgie envelope
PM to me, please?
Silly me didn't copy your address from the Budgie envelope
PM to me, please?
-= Gregg =-
Fine wine comes in glass bottles, not plastic sacks. Therefore the finer electrons are also found in glass bottles.
Fine wine comes in glass bottles, not plastic sacks. Therefore the finer electrons are also found in glass bottles.
-
Geek - KT88
- Posts: 3585
- Joined: Sun Oct 21, 2007 3:01 am
- Location: Chilliwack, British Columbia
7 posts
• Page 1 of 1
Who is online
Users browsing this forum: No registered users and 1 guest